So I've been trying to acquire some (raw yet anonymized) polling data on nuclear power. No org ever shared any data with me that wasn't already available on their websites. (Usually summary findings and not any sort of spreadsheet.)
Wasted WAY too much time asking and groveling.
Here's a not-very scientific nuclear power. But I got to do it myself and ask exactly the questions I was curious about.
The original poll as seen by participants:
https://docs.google.com/forms/d/e/1FAIpQLSfrytlTZ1SK5lxKNXQSUotzToZ44uC-iLFmh5pRnf2d4Odr-w/viewform
Results in a Google Sheet:
https://docs.google.com/spreadsheets/d/14wgEhjObP3AYEYnAuE5F5TONRg-v7pyRi1CARK6M4lA/edit?usp=sharing
Anyone can view this sheet. If you'd like to play with it make a personal copy into your own Google Drive. (Or download it and use Excel.)
I'm thinking this a polling approach I'd like to see among larger, more serious, nuclear advocacy organizations. This was only my first attempt (after sharing early drafts on Twitter and Reddit and with fellow C4NE volunteers for feedback). It barely delivered any information... lots of questions are asked but participants were not corrected on their many misunderstandings.
Push-polls can be a useful thing. This was not a push-poll.
The only information delivered to participants was IPCC's lifecycle emission numbers from 2014, and CNS's paper on CANDU lifecycle emissions.
It was not the point of this poll to shift opinions, only explore them. But by sharing these numbers with participants, opposition dropped by 8% and support rose by 8%.
How many participants you ask? 100 participants.
I'd like to perfect this poll first... this is your chance to chime in on what you see. Obviously the next iteration will look into delivering more corrective info to participants.
Hopefully some nuclear advocacy org can run it with a larger sample size.
Participants came from Prolific. It cost about $1.50 per participant. So its not quite a phone-call-poll cross-section of society... most of the participants were young. But I'm not really trying to find out any "% of people believe" information... I created this to dig into what beliefs are correlated rather than absolute values.
(That's why you see me asking about COVID vaccines.)
Poll Analysis
Of the 32% who supported nuclear power at the beginning of the poll, 31/32 favor widespread vaccination efforts. The 1 person not-in-favor said they had no opinion. 0 opposed.
Of the 22% who opposed nuclear power at the beginning of the poll, 17/22 favor widespread vaccination efforts. 1 person said they had no opinion. 1 said they'd rather not say. 3 expressed opposition.
Women are more likely to oppose nuclear. Men are more likely to support nuclear.
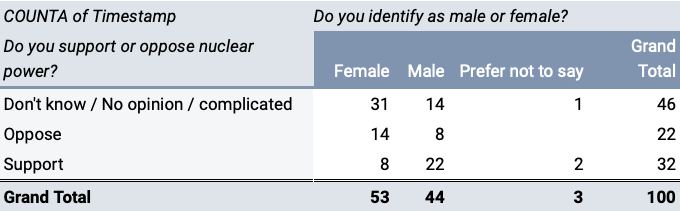
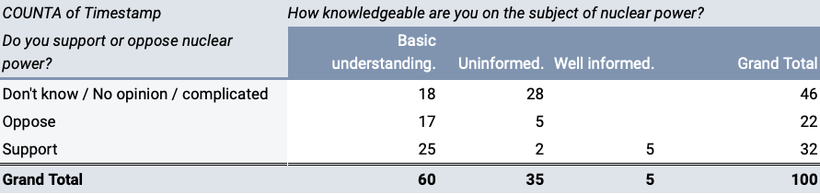
Only men claimed to be "well informed" about nuclear power. Those men claiming to be "well informed" all supported nuclear power at start of poll.
Of both men and women, the people least likely to support nuclear power are those who feel "uninformed" about it.
Only people who support nuclear power were likely to know that it does not involve combustion.
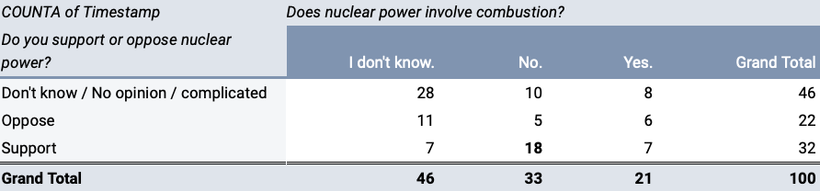
People who knew nuclear power does not involve combustion were over 3x as likely to support nuclear power.
1 in 3 people who thought nuclear power involved combustion were supportive of nuclear power.
Over half the people who thought nuclear power did not involve combustion were supportive of nuclear power.
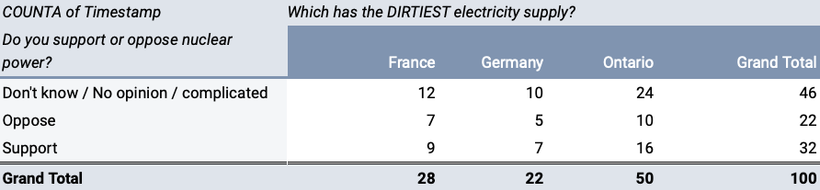
Only 22% of people knew that Germany has the dirtiest electricity supply.
Half the people thought Ontario had the dirtiest electricity supply.
Being aware which has the dirtiest air doesn't correlate with supporting nuclear.

People who believe that most of their radiation exposure comes from nuclear plants are the most likely to oppose them and least likely to support them.
People who believe that most of their radiation exposure does not come from nuclear plants are the most likely to support them and least likely to oppose them.

Only 30% of participants thought hydropower was the largest low-carbon source of electricity in Canada.
10% of participants (most of which support nuclear) think (mistakenly) that nuclear is the largest low-carbon source of electricity in Canada.
Lowest support for nuclear power (only ~8% support) was found among people who believe solar or wind are Canada's biggest source of low-carbon electricity.
Thinking (knowing?) hydropower is Canada's largest source of low-carbon electricity does not mean you are likely to support nuclear.
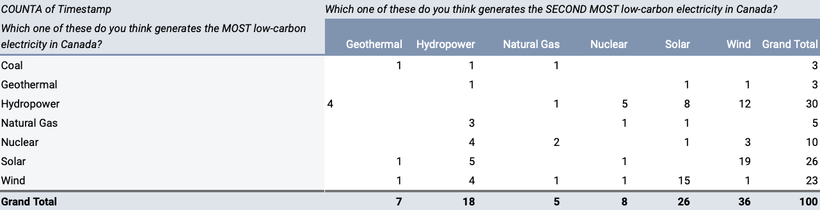
Overall only 18% (10% + 8%) of people believe nuclear ranks in the top-2 Canadian low-carbon electricity sources.
(7+4)/32 = 34% of nuclear supporters believe nuclear ranks in top-2 Canadian low-carbon electricity sources.
(1+1)/22 = 9% of nuclear opponents believe nuclear ranks in top-2 Canadian low-carbon electricity sources.
The following chart shows ONLY nuclear OPPONENTS...
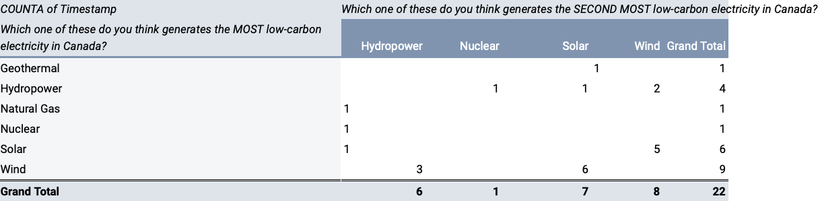
((1+6+9)/22) = 73% of nuclear opponents believe solar or wind or geothermal is Canada's biggest low-carbon source of electricity.
(4/22) = 18% of nuclear opponents believe hydropower is Canada's biggest low-carbon source of electricity.
((3+4)/22) = 32% of nuclear opponents believe hydropower ranks in top-2 among Canada's low-carbon sources of electricity.
100-32 = 68% of nuclear opponents have a fundamentally broken perspective on Canada's low-carbon sources of electricity. (Hydro not ranking in top-2.)
The following chart shows ONLY nuclear SUPPORTERS...
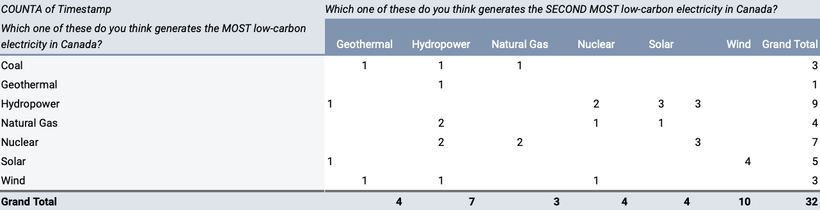
((1+5+3)/32) = 28% of nuclear supporters believe solar or wind or geothermal is Canada's biggest low-carbon source of electricity.
(9/32) = 28% of nuclear supporters believe hydropower is Canada's biggest low-carbon source of electricity.
((7+9)/32 = 50% of nuclear supporters believe hydropower ranks in top-2 among Canada's low-carbon sources of electricity.
100-50 = 50% of nuclear supporters have a fundamentally broken perspective on Canada's low-carbon sources of electricity. (Hydro not ranking in top-2.)
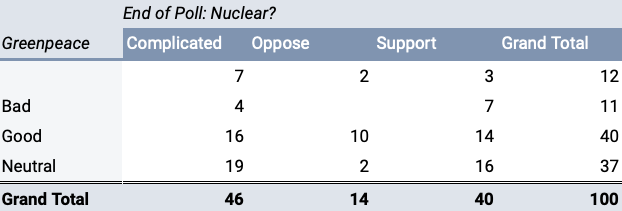
Supporters of nuclear might have any opinion about Greenpeace.
Opponents of nuclear never have a bad opinion about Greenpeace.
2/3 of nuclear opponents associate Greenpeace with "Good".
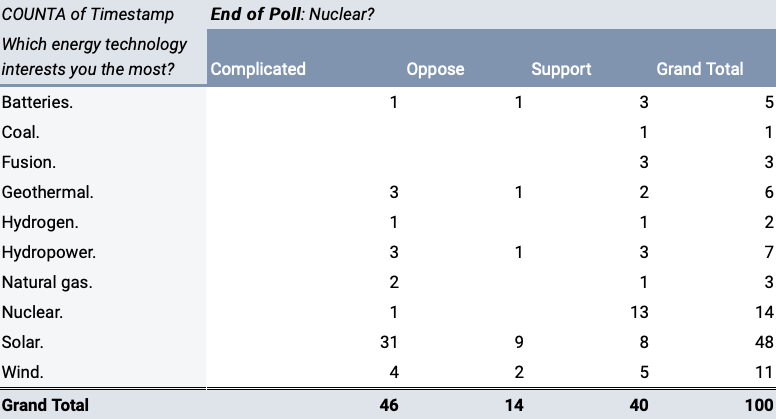
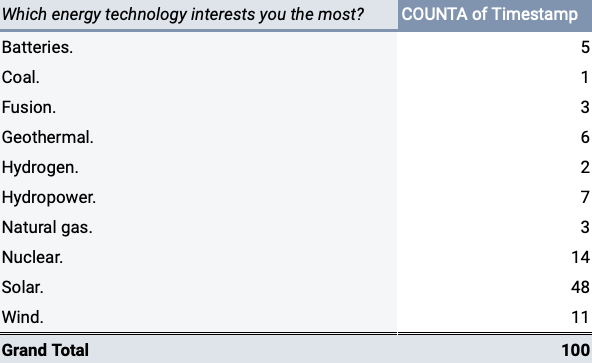
Solar power "interests" people the most, followed in distant 2nd by nuclear, then wind.
People interested in solar power were most likely to oppose nuclear power.
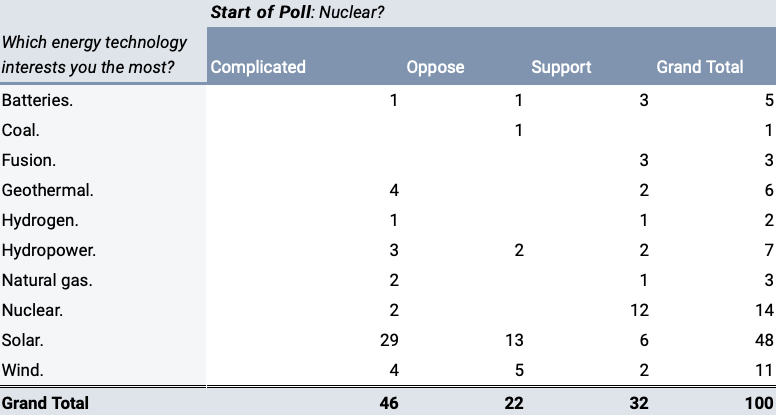
The opposition to nuclear among people interested in solar declined ((13-9)/13) = 31% by the end of the poll.
The opposition to nuclear among people interested in wind declined ((5-2)/5) = 60% by the end of the poll.
Likely this was because people interesting in solar and wind have learned about IPCC's emission lifecycle numbers, and CNS lifecycle numbers for CANDU.
Thoughts on doing a poll like this...
Was expecting opposition to nuclear to include mis-informed people who thought they were well informed about nuclear. It did not.
Was expecting most supporters of nuclear power to know Ontario's grid was clean, they did not.
Wasn't expecting anyone's opinion to change during the poll, but 8% switched from opposing nuclear power to supporting nuclear power during the poll.
Facts I'd like to deliver in future push-poll are:
- Hydro and nuclear provide most of Canada's low-carbon electricity.
- Solar and wind provide very little of Canada's low-carbon electricity.
- Nuclear does not expose people to the most radiation.
- Continue informing about CO2 lifecycle emissions for different energy sources.
I don't think polling is any sort of economical means to change people's opinions. But we can confirm which pieces of information matter, and which do not.
I'm under the impression most polling data we've seen around nuclear power was designed to try make nuclear power look good, and not dig into correlated beliefs.
Feel free to dig around for your own answers...
There's political party affiliation and age-of-participants. The more typical types of data for polling.
Copy (or download) the sheet, play around with pivot tables, if you find anything interesting let me/us know.
Lots of the data is might looks confusing at first, because (for example) more than 1 political party could be selected and those multiple values are all packed into a single column.
Pivot tables let you filter by whether a string can be found within a cell. So to know how people who think of themselves as "NDP" (among other things) view different energy sources you can filter political to contain "NDP"...
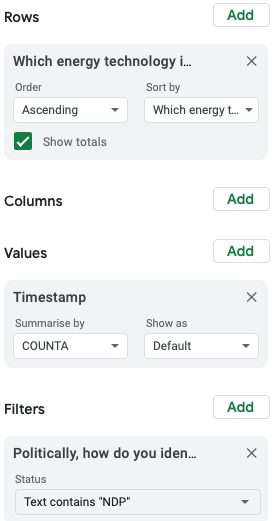
...this is only people who think of themselves as NDP...
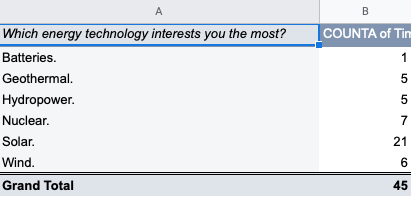
...lots of ways to navigate this data even with these merged values.
If I run a poll with a large sample size, I'll break everything out into columns
But with only 100 participants I'd rather just stop.
It just isn't accurate enough to warrant any more playing.